
AI-generated illustration.
A raise changes the price of an hour. Paid hours and everyday prices determine what the week can buy.
A raise changes one number: the hourly rate. What a week of work can buy depends on two others as well, the hours actually paid and what happens to prices over the same stretch of time.
Weekly pay is the hourly rate multiplied by paid hours, so a shorter paid week can cancel out a higher rate. Buying power is that weekly pay adjusted for prices, so rising prices can shrink it further. That is how a bigger hourly rate can come with a smaller weekly budget.
Weekly pay is a rate times paid hours
Take a hypothetical hourly job. In a baseline period it pays $25 an hour for 40 regular paid hours: $1,000 a week before anything is withheld. In a later period the rate rises 3%, to $25.75, which on the same 40 hours would come to $1,030.
Suppose instead the later schedule pays 38 hours. The week then comes to $978.50: $21.50, or 2.15%, less than the baseline week, even with the raise.
Splitting the change: the raise versus lost hours
The first chart breaks that $21.50 into two steps, raise first and hours second. Applying the 75-cent raise to the original 40 hours adds $30 a week. Removing two hours at the new $25.75 rate takes away $51.50. The net is a $21.50 decline, not adjusted for prices.
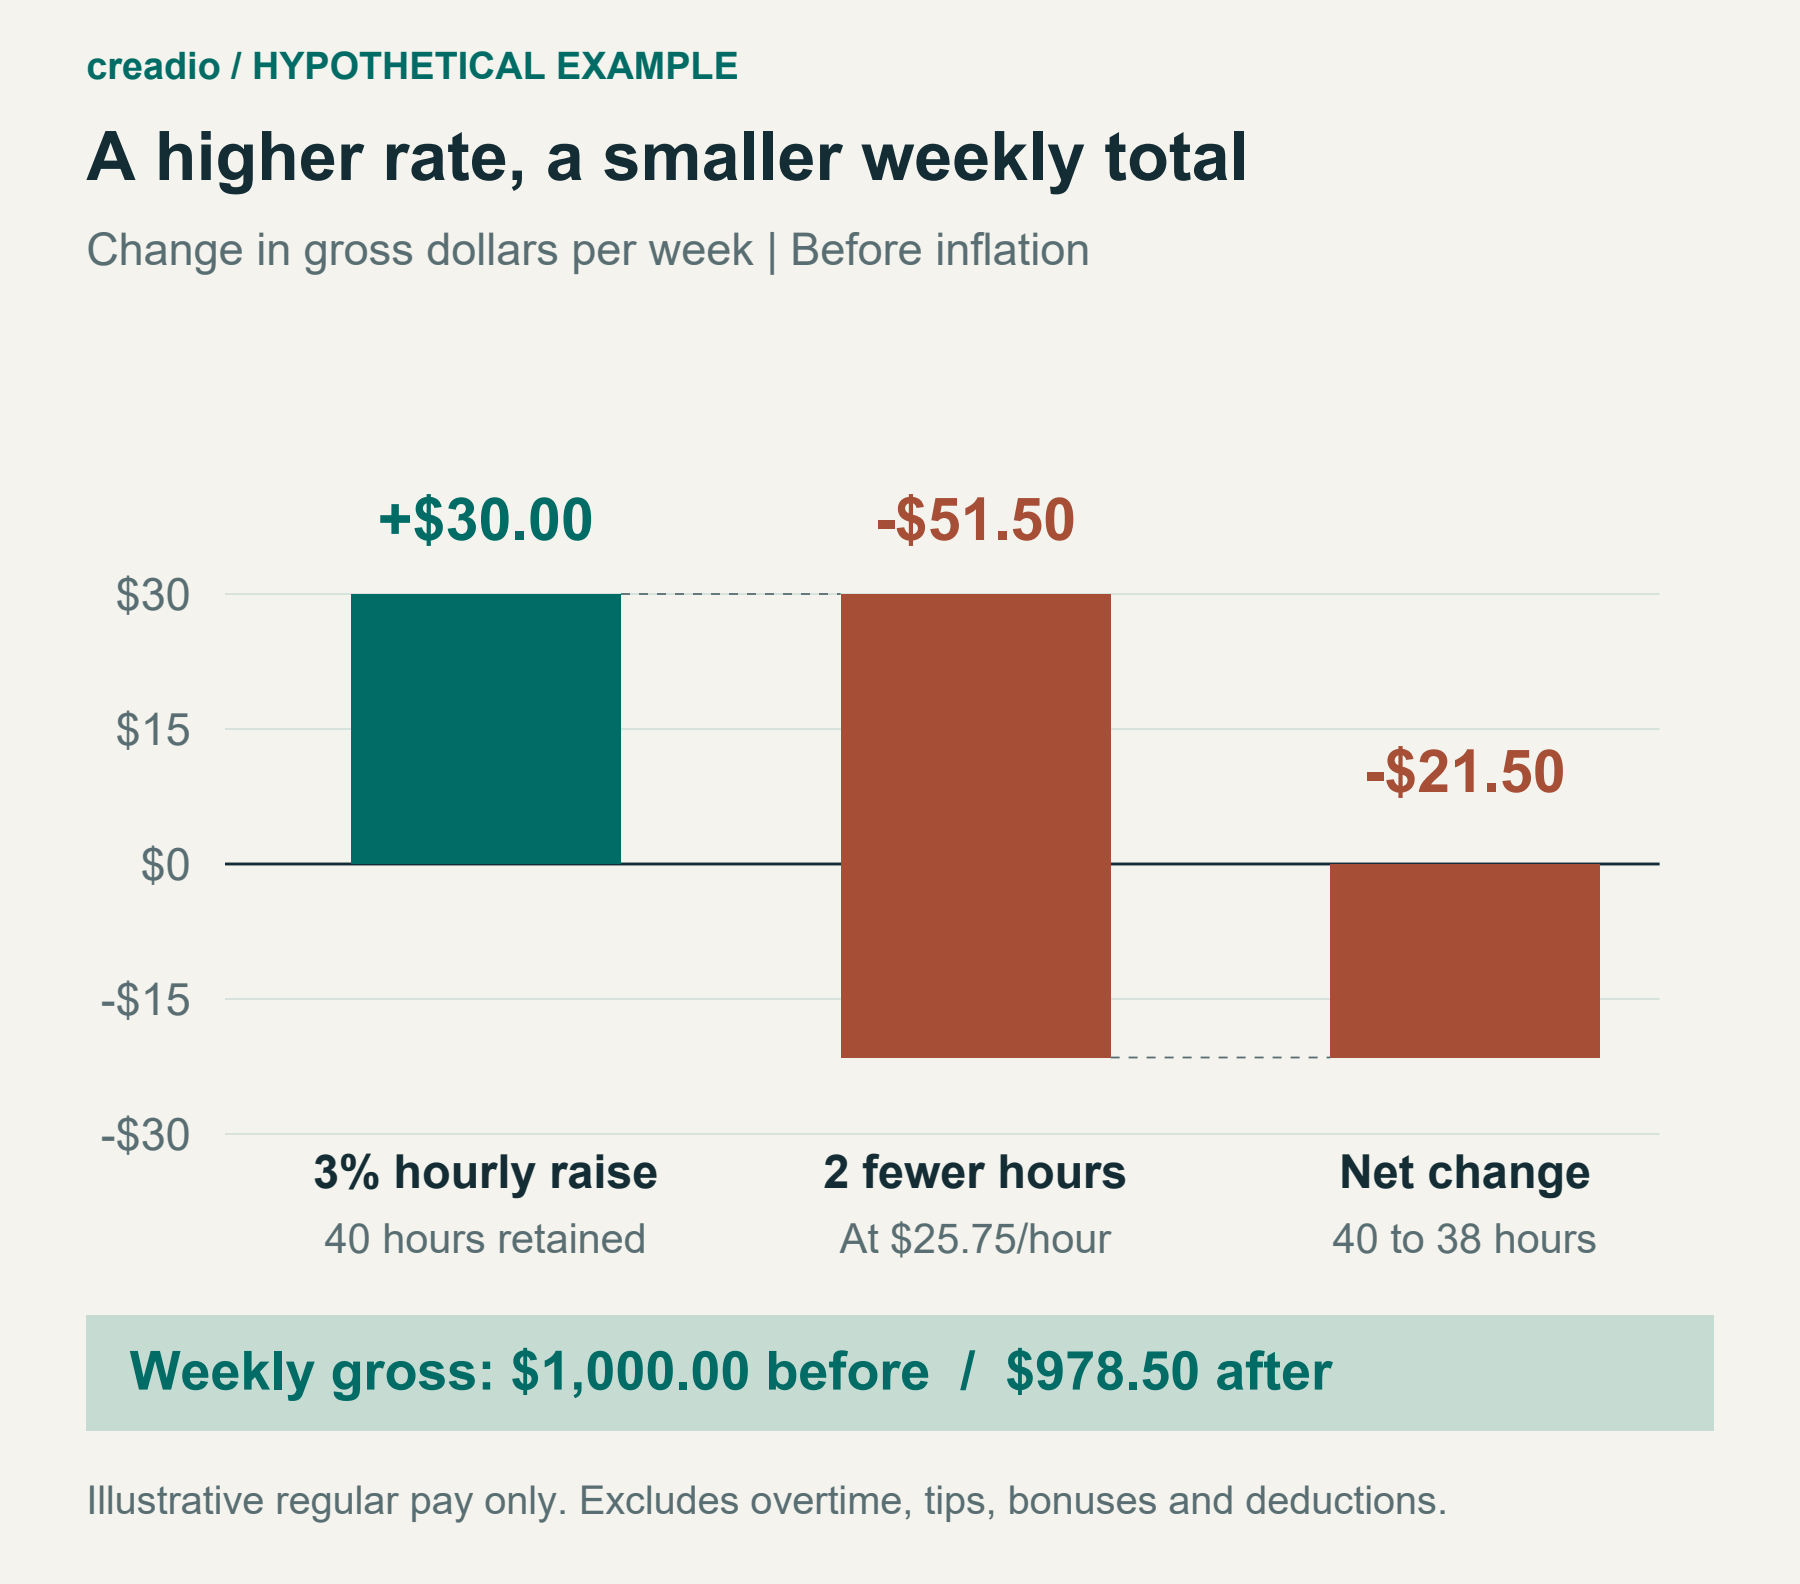
All of these are gross figures for regular hours, leaving out overtime, bonuses and tips. They also come before taxes and benefit deductions, which can change on their own, so gross pay is not the deposit.
A shorter paid week can follow from fewer scheduled shifts, a slow season or unpaid time away from work. The arithmetic is the same in each case and says nothing about who made the call. It also assumes pay tied to hours; for salaried workers paid the same regardless of weekly hours, only the price side carries over.
Adjusting for prices over the same period
Now suppose the overall price level rises 3% over the same comparison period. The later $978.50 is then worth $950 in baseline dollars, meaning at baseline-period prices ($978.50 ÷ 1.03 = $950). That is 5% less buying power than the baseline week, despite the higher rate.
| Item | Baseline | Later period | Change |
|---|---|---|---|
| Hourly rate | $25.00 | $25.75 | +3% |
| Paid hours per week | 40 | 38 | −5% |
| Weekly gross pay | $1,000.00 | $978.50 | −2.15% |
| Price level (baseline period = 100) | 100 | 103 | +3% |
| Weekly gross pay in baseline dollars | $1,000.00 | $950.00 | −5% |
Percentage changes compound, so combine them by multiplying and dividing, not adding and subtracting. A 3% raise on 5% fewer hours is 1.03 × 0.95 = 0.9785, a 2.15% drop rather than the 2% that subtraction suggests; dividing by 1.03 for prices leaves 0.95. Prices compound too: inflation that slows but stays above zero still lifts the level a raise must cover, as we explained in why lower inflation doesn’t mean lower prices.

How many paid hours a raise can absorb
The second chart keeps the same hypothetical 3% raise and 3% price increase, still counting gross pay for regular hours, and changes only the schedule. At 40 paid hours the week pays $1,030, worth $1,000 in baseline dollars: the raise keeps pace with prices and no more. At 38 hours, buying power is $950. At 36 hours the week pays $927, worth $900, a 10% loss.
The general test is a break-even schedule: the old weekly pay times one plus the price change, divided by the new hourly rate. Here, $1,000 × 1.03 ÷ $25.75 = 40 hours, the old schedule exactly, because the raise only matches prices. Buying power improves only above that line; below it, each lost hour costs $25 in baseline dollars, or 2.5% of the original week.

What the official averages can and can’t show
Official weekly figures are built the same way. In its Real Earnings technical note, the Bureau of Labor Statistics (BLS) describes average weekly earnings from the Current Employment Statistics survey as average hourly earnings, calculated over paid hours, times average weekly hours. These averages cover private nonfarm jobs, including part-time jobs and the extra jobs of multiple jobholders, which BLS says tends to put weekly averages well below full-time levels. They are means across all jobs, not typical workers’ pay, and they move with employment shifts between high- and low-wage industries as well as with wage rates. BLS adjusts all-employee earnings for inflation with the CPI-U, and production and nonsupervisory earnings with the CPI-W.
So a change in the average is not the same as a typical worker’s raise. A 2024 BLS Beyond the Numbers article, Did the COVID-19 pandemic affect real earnings?, shows a historical case: in March and April 2020, job losses concentrated in lower-paying industries pushed up average hourly earnings for those still on private payrolls, a jump that reflected who was still being counted. It also explains how pay is converted into purchasing power and how weekly hours figure in real weekly earnings.
Prices are averaged too. BLS’s CPI questions and answers note that the index is based on an average household, not any particular family, so households that spend differently can face different rates. A grocery bill that grows because more goes into the cart reflects quantity, not inflation.
As of October 13, 2026 (Korea time), the BLS October release calendar listed September’s Consumer Price Index and Real Earnings for October 14 at 8:30 a.m. Eastern. Neither had been published when this was written. When they are, the weekly figures, which reflect hours as well as pay rates, are worth reading alongside the hourly ones.

How to check your own pay periods
A personal comparison holds up better with a few habits:
- Same window. Compare pay periods of equal length, and measure prices over the same stretch between them.
- Rate and hours. Record the hourly rate and paid hours separately, not just the total.
- Gross versus take-home. Keep them apart; taxes and deductions change on their own.
- Extras. Set overtime, bonuses and tips aside, or track them as a separate line.
- Your basket. The national CPI is an average, and your spending weights may differ.
- Break-even hours. Run the test above with your own numbers.
None of this makes a raise less real or less earned. It only means the rate, the hours and the prices belong in the same calculation. If a raise hasn’t made the weeks feel any easier, that may be an accurate reading, not a budgeting failure. Finding out which of the three numbers moved is a better place to start than second-guessing every purchase.
Leave a Reply